Web design and development

Web design for St. Louis businesses

We design and build custom websites for St. Louis businesses remotely from Malvern, PA, with the scope, price and schedule in writing first.

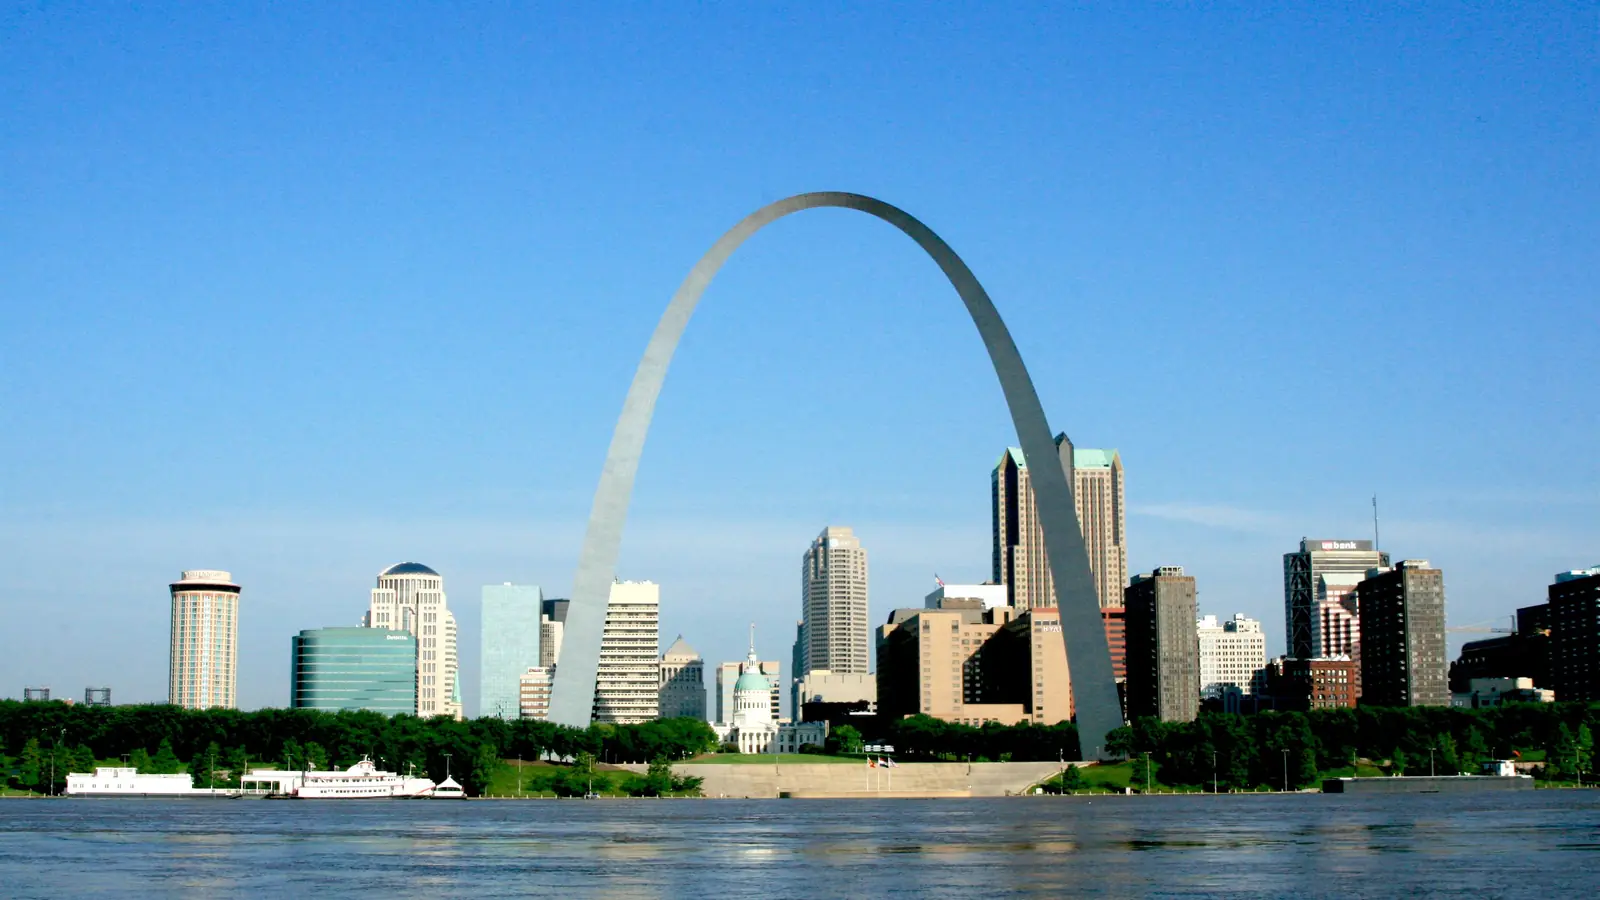
The Gateway Arch and downtown St. Louis across the Mississippi River under a clear sky.

Website design for St. Louis, delivered remotely

We take on website work for St. Louis businesses remotely from Malvern, PA, and every stage is reviewed in your own browser.

Why it matters: 69,470 business establishments operated in the metro in 2023, and 83.5% of them employed fewer than 20 people.

Go deeper: how a remote build runs, stage by stage

Health care and social assistance alone holds 15.5% of the 1,263,674 paid employees counted in the metro in 2023.

Retail trade adds 10.9% and accommodation and food services 10.1%, so three sectors hold 36.5% of the payroll count.

The three cards above are the three largest of the 12 sectors we read for the metro, by paid employees: health care and social assistance, retail trade and accommodation and food services.

Manufacturing is fourth, with 110,031 paid employees in 2,220 establishments.

  1. Health care

    195,488 paid employees across 10,427 establishments in 2023; a site here needs online booking, intake forms and an accessible path for every patient.

  2. Retail

    138,025 paid employees across 8,095 establishments in 2023; a site here needs stock that matches the till and a phone checkout.

  3. Hospitality and food

    127,473 paid employees across 6,384 establishments in 2023; a site here needs hours, menus and bookings that read on a phone in a hurry.

Websites we built

Six live sites we built open here in a preview window, the same way your build is reviewed before launch.

Why it matters: A working site shows how a build loads, reads and takes an enquiry, which no mock-up can.

Go deeper: how the previews work

Preview opens the live site inside a sandboxed frame on this page. Atlas Peptides blocks framing, so its preview is a dated screenshot instead.

None of the six is presented as a St. Louis business; each one shows a job a site has to do, whatever the city.

Between them they cover a configurator that prices as you build, online scheduling, booking with reviews pulled in, a shared stock count, a quote form and a checkout.

The Phantom Arcades website, built by OneAlgorithm

Phantom Arcades

Custom home arcade cabinets

A configurator that prices the cabinet as you build it, and a page for every machine he has made.

The Inspect This Home Inspections website, built by OneAlgorithm

Inspect This Home Inspections

Home inspection

Service pages by area, online scheduling, and reports the owner updates himself.

The The Boards Professor website, built by OneAlgorithm

The Boards Professor

Medical exam tutoring

Booking, tutor profiles and reviews pulled from two platforms into one page.

The The Gorband website, built by OneAlgorithm

The Gorband

Hand block-printed cotton clothing

Moved off Shopify onto Square: one catalogue and stock count for the website and the market stall.

The Starzi Brothers website, built by OneAlgorithm

Starzi Brothers

Excavation and concrete contractors

Moved off Squarespace: a page for each service and town, and a quote form that lands in the office inbox.

The Atlas Peptides website, built by OneAlgorithm

Atlas Peptides

Research peptides

A shop with Stripe checkout and a lab certificate for every lot.

69,470 businesses, in public numbers

The metro had 69,470 business establishments in 2023, −4.3% since 2018, by County Business Patterns.

By the numbers: 2,809,527 people lived in the metro in 2024, +0.3% since 2019, and payrolls counted 1,263,674 employees.

69,470

Establishments, 2023

Census CBP 2023 · −4.3% from 72,597 in 2018 ·

83.5

% under 20 staff

Census CBP 2023 · 58,020 of 69,470 ·

452

Programming firms (541511)

Census CBP 2023 · −1.5% since 2018 ·

65.1

541511 per 10,000

Census CBP 2023 · 452 of 69,470, a ceiling ·

146.7

5415 per 10,000

Census CBP 2023 · 1,019 establishments ·

2,809,527

Population, 2024

Census ACS 1-year 2024 · +0.3% since 2019 ·

-3,127

Change since 2018

Census CBP 2018 and Census CBP 2023 · 72,597 to 69,470 ·

Go deeper: what County Business Patterns counts

Of the 69,470 establishments, 58,020 had fewer than 20 people and 9,553 employed 20 to 99. Another 1,704 employed 100 to 499, and 193 employed 500 or more.

Within the 20-to-99 band, 7,158 establishments had 20 to 49 people and 2,395 had 50 to 99. The average establishment employed 18.2 of the 1,263,674 paid staff.

County Business Patterns counts employer establishments, locations with paid staff, so a sole owner with no employees is not in the 69,470; that is one establishment for every 40.4 residents.

NAICS 541511, custom computer programming, includes custom web page design and all other custom software, so 65.1 per 10,000 businesses is a ceiling on web-design firms in the metro.

Health care leads, with 195,488 employees

Health care and social assistance employed 195,488 people in the metro in 2023, the most of the 12 sectors we read.

Why it matters: who a site talks to follows the sector mix, and retail trade comes next at 138,025 employees.

  • Health care: 18.7 employees per establishment; booking and intake matter most.
  • Retail: 17.1 employees per establishment; stock and checkout must agree.
  • Hospitality and food: 20 employees per establishment; hours and menus must read fast.
Go deeper: who these pages are written for

10,427 health care and social assistance establishments in the metro need online booking, intake forms and an accessible path for every patient. The 8,095 in retail trade need stock that matches the till and a phone checkout.

Accommodation and food services counts 6,384 establishments that need hours, menus and bookings that read on a phone in a hurry, and manufacturing, fourth at 110,031 employees, needs spec sheets, distributor lookups and request-for-quote forms.

Professional, scientific and technical services ranks fifth at 90,808 employees, and the 12 sectors we read cover 1,057,471 of the 1,263,674 paid employees in the metro.

Together the four employ 571,017 people, 45.2% of the payroll count; the sector figures shape the scope, and the six sites above are our delivered work.

The St. Louis metro: the four largest of 12 sectors by paid employees, Census CBP 2023
SectorPaid employees, 2023Establishments, 2023
Health care195,48810,427
Retail138,0258,095
Hospitality and food127,4736,384
Manufacturing110,0312,220

452 custom programming firms in the metro

452 custom computer programming establishments (NAICS 541511) operated in the metro in 2023, −1.5% since 2018.

Yes, but: that code also covers all custom software, so 65.1 per 10,000 businesses is a ceiling on web-design firms, not a count.

  • Graphic design (NAICS 541430): 127 establishments in 2023.
  • Marketing consulting (NAICS 541613): 342 establishments in 2023.
  • Advertising agencies (NAICS 541810): 99 establishments in 2023.
Go deeper: how to compare the firms on your list

With 579 programming and graphic design establishments in the metro, ask each firm for live sites you can open, who will own the code and domain, and a written scope.

The wider NAICS 5415 group, computer systems design and related services, counted 1,019 establishments, 146.7 per 10,000 businesses.

Marketing consulting (342) and advertising agencies (99) often sell websites too, so the full field in the metro is wider than the programming count.

Custom programming establishments went from 459 in 2018 to 452 in 2023, while graphic design stood at 127, 18.3 per 10,000 businesses.

Those 452 programming firms employed 8,770 people, about 19.4 each. The wider 5415 group employed 16,967.

From 72,597 to 69,470 businesses since 2018

Establishments in the metro fell from 72,597 in 2018 to 69,470 in 2023, a change of −4.3%.

The bottom line: real estate, rental and leasing grew the most of the 12 sectors, +4.2% in establishments, while health care and social assistance moved −16%.

  • 20 to 99 employees: 9,755 establishments in 2018, 9,553 in 2023.
  • 100 to 499 employees: 1,800 in 2018, 1,704 in 2023.
  • 500 or more employees: 189 in 2018, 193 in 2023.
Go deeper: what the change means for a website

Real estate, rental and leasing went from 3,095 to 3,226 establishments between 2018 and 2023; health care and social assistance went from 12,419 to 10,427.

Accommodation and food services came second, +4.1%, and construction third, +1.9%.

That is a net loss of 3,127 establishments: each new one needs a first site, and each established one carries addresses and rankings a rebuild must keep.

Paid employees went from 1,254,268 to 1,263,674 over the same years, +0.7%. Population moved +0.3% from 2019 to 2024, to 2,809,527.

Ranked 40th of 64 places by businesses

The metro ranks 40th of the 64 places we build pages for by business establishments, and 52nd for programming firms per 10,000 businesses.

By the numbers: population growth since 2019 ranks 57th of 64, and the share of establishments under 20 staff ranks 49th.

Go deeper: why every place is measured the same way

Every place page uses the same Census tables, so these ranks compare like with like: 69,470 establishments here against the 64 places' own counts, 63rd for their change since 2018.

Programming firms run 65.1 per 10,000 businesses here against a median of 85.2. The under-20 share is 83.5% against 84.4%.

The 64 are the places whose web design searches clear 500 a month in Semrush's exact data, state pages counted with any places folded in; this one draws 1,950, 15th of the 134 places we measured nationwide.

The St. Louis metro against the median of the 64 place pages, Census CBP 2023 and ACS 2024
MeasureHereMedian of 64
Programming per 10,00065.185.2
Establishments since 2018−4.3%+5.2%
Population since 2019+0.3%+4.2%
Under 20 staff83.5%84.4%

How a St. Louis web project runs

A project here runs in the same five stages as every build of ours, from agreeing what the site is for to launch.

What you get: the scope, price and schedule in writing at stage two, before anything is designed or built.

Go deeper: what happens at each stage

Stage one fixes who the site talks to; in the metro, where health care and social assistance employs 195,488 people, that answer often sets the integrations.

Stage five hands the site over in your own accounts, a handover any of the 1,019 systems design establishments in the metro could pick up from.

For the 8,095 retail trade establishments here, stage two usually lists stock that matches the till and a phone checkout.

Diagram of the five stages of a St. Louis web project, stacked for phones01Agree the purposeaudience · job · connections02Scope in writingpages · price · dates03Design in the browserreal content · real widths04Build and wire it upcode · forms · CRM · analytics05Launch and hand overyour repo · domain · hostingDiagram of the five stages of a St. Louis web projectA rail runs through five stations: agree what the site is for; scope, price and schedule in writing; design in the browser; build and wire it up; launch, hand over and stay on.01Agree the purposeaudience · job · connections02Scope in writingpages · price · dates03Design in the browserreal content · real widths04Build and wire it upcode · forms · CRM · analytics05Launch and hand overyour repo · domain · hosting
The five stages in order; the written scope, price and schedule come at stage two.
  1. Agree what the site is for

    Who the site talks to, what it must get them to do, and what it connects to.

  2. Scope, price and schedule in writing

    Pages, integrations, price and dates on paper before any design starts.

  3. Design in the browser

    Real content at real widths, reviewed on your own phone as it takes shape.

  4. Build and wire it up

    Code, forms, CRM, analytics and accessibility checks, in one pass.

  5. Launch, hand over, stay on

    The site goes live in your accounts, and we stay on for support.

Working with us from St. Louis

St. Louis runs on Central time, so our 9-to-5 Eastern day is 8 a.m. to 4 p.m. there.

The bottom line: the office answers (610) 890-9711 Monday to Friday, 8 a.m. to 4 p.m. local time, the day 452 programming firms here keep.

OneAlgorithm625 Swedesford Rd, Unit B, Malvern, PA 19355(610) 890-9711Mon–Fri 9–5Google Business Profile: 5.0 from 6 reviews, read 23 Oct 2026 Updated 24 October 2026

Do you have an office in St. Louis?

No. Our one office is in Malvern, PA, and projects here run remotely, with every stage reviewed in your own browser.

Go deeper: calls, reviews and where the work happens

Calls and screen-shares cover the whole build, and you review the work in your own browser between them; no branch office or answering service sits in between.

Web design questions from the metro

Not answered here? Call the office: (610) 890-9711

Yes. We take on website work for St. Louis businesses remotely from Malvern, PA, and every stage is reviewed in your own browser. You deal directly with the people designing and coding the site, and calls are set in Central hours, the clock the metro's 69,470 establishments keep.

The scope sets the price, not the ZIP code: pages, integrations and what the site must do, for one of the 58,020 small establishments here or a larger one. You get the price and schedule in writing first; advertisers paid about $16.89 a click for the main web design phrasing here (Semrush).

Hire a designer when the site has to book, quote, sell or connect to a CRM; a builder fits a site a standard template can serve. In the metro, 83.5% of establishments employ fewer than 20 people, so we say which route fits before quoting anything.

Yes. Titles, headings, page speed and schema go in while the site is built, and Search Console is connected at launch, so the 1,950 monthly searches (top phrasing 880) in the table above are targeted from day one. “web design st louis” alone draws 880 a month, by Semrush’s count.

Open the live sites a firm has built, ask who owns the code, domain and hosting, and get the scope and price in writing. With 579 programming and graphic design establishments in the metro, and 65.1 programming firms per 10,000 businesses, those three checks shorten the list quickly.

The site goes live on hosting in your name, with the domain in your account, and we stay on for support under the written proposal. Any of the 1,019 computer systems design establishments in the metro can pick it up later, because nothing is locked to us.

Yes. 58,020 of the 69,470 establishments in the metro had fewer than 20 employees in 2023, and every one of the six sites above is for an owner-led business. The scope starts with the one job the site must do, booked, quoted or sold.

Start your St. Louis website project

Tell us what the site has to do, and the scope, price and schedule come back in writing before anything is built.

What to have ready

  • What the site has to do: sell, book, explain or log people in
  • Two or three sites you like, and why
  • What you already have: domain, hosting, content, logins

What happens next

  1. 01Send it on the contact page, or call the office.
  2. 02A person at OneAlgorithm reads it and replies.
  3. 03If it fits, the written scope, price and schedule follow.

Start a project

Topic · Website · St. Louis

What does the site have to do? Tell us on the contact page; the topic is already filled in.

Start a project

Prefer to talk it through?

(610) 890-9711

OneAlgorithm · 625 Swedesford Rd, Unit B, Malvern, PA 19355 · Mon–Fri 9–5

Where these figures come from

Every Census figure on this page covers the St. Louis metro area (Census CBSA code 41180). County Business Patterns (CBP) counts employer establishments; the American Community Survey (ACS, 1-year) gives population. A person at OneAlgorithm read them on 24 October 2026. The query each one came from is printed as text, not linked.

FigureValueYear
Establishments, 202369,4702023
api.census.gov/data/2023/cbp?get=ESTAB,EMP,EMPSZES&NAICS2017=00&for=metropolitan%20statistical%20area/micropolitan%20statistical%20area:41180
Business establishments, 201872,5972018
api.census.gov/data/2018/cbp?get=ESTAB,EMP,EMPSZES&NAICS2017=00&for=metropolitan%20statistical%20area/micropolitan%20statistical%20area:41180
Paid employees, mid-March 20231,263,6742023
api.census.gov/data/2023/cbp?get=ESTAB,EMP,EMPSZES&NAICS2017=00&for=metropolitan%20statistical%20area/micropolitan%20statistical%20area:41180
Population, 20242,809,5272024
api.census.gov/data/2024/acs/acs1?get=NAME,B01003_001E&for=metropolitan%20statistical%20area/micropolitan%20statistical%20area:41180
Population, 20192,801,4232019
api.census.gov/data/2019/acs/acs1?get=NAME,B01003_001E&for=metropolitan%20statistical%20area/micropolitan%20statistical%20area:41180
Programming firms (541511)4522023
api.census.gov/data/2023/cbp?get=ESTAB,EMP&NAICS2017=541511&EMPSZES=001&for=metropolitan%20statistical%20area/micropolitan%20statistical%20area:41180
NAICS 541511 establishments, 20184592018
api.census.gov/data/2018/cbp?get=ESTAB,EMP&NAICS2017=541511&EMPSZES=001&for=metropolitan%20statistical%20area/micropolitan%20statistical%20area:41180
Computer systems design establishments (NAICS 5415)1,0192023
api.census.gov/data/2023/cbp?get=ESTAB,EMP&NAICS2017=5415&EMPSZES=001&for=metropolitan%20statistical%20area/micropolitan%20statistical%20area:41180
Establishments with 20-49 employees, 20237,1582023
api.census.gov/data/2023/cbp?get=ESTAB,EMP,EMPSZES&NAICS2017=00&for=metropolitan%20statistical%20area/micropolitan%20statistical%20area:41180
Establishments with 50-99 employees, 20232,3952023
api.census.gov/data/2023/cbp?get=ESTAB,EMP,EMPSZES&NAICS2017=00&for=metropolitan%20statistical%20area/micropolitan%20statistical%20area:41180
Establishments with 100-249 employees, 20231,3282023
api.census.gov/data/2023/cbp?get=ESTAB,EMP,EMPSZES&NAICS2017=00&for=metropolitan%20statistical%20area/micropolitan%20statistical%20area:41180
Establishments with 250-499 employees, 20233762023
api.census.gov/data/2023/cbp?get=ESTAB,EMP,EMPSZES&NAICS2017=00&for=metropolitan%20statistical%20area/micropolitan%20statistical%20area:41180
Establishments with 500-999 employees, 20231122023
api.census.gov/data/2023/cbp?get=ESTAB,EMP,EMPSZES&NAICS2017=00&for=metropolitan%20statistical%20area/micropolitan%20statistical%20area:41180
Establishments with 1,000 or more employees, 2023812023
api.census.gov/data/2023/cbp?get=ESTAB,EMP,EMPSZES&NAICS2017=00&for=metropolitan%20statistical%20area/micropolitan%20statistical%20area:41180
Health care and social assistance: paid employees195,4882023
api.census.gov/data/2023/cbp?get=ESTAB,EMP&NAICS2017=62&EMPSZES=001&for=metropolitan%20statistical%20area/micropolitan%20statistical%20area:41180
Health care and social assistance: establishments10,4272023
api.census.gov/data/2023/cbp?get=ESTAB,EMP&NAICS2017=62&EMPSZES=001&for=metropolitan%20statistical%20area/micropolitan%20statistical%20area:41180
Retail trade: paid employees138,0252023
api.census.gov/data/2023/cbp?get=ESTAB,EMP&NAICS2017=44-45&EMPSZES=001&for=metropolitan%20statistical%20area/micropolitan%20statistical%20area:41180
Retail trade: establishments8,0952023
api.census.gov/data/2023/cbp?get=ESTAB,EMP&NAICS2017=44-45&EMPSZES=001&for=metropolitan%20statistical%20area/micropolitan%20statistical%20area:41180
Accommodation and food services: paid employees127,4732023
api.census.gov/data/2023/cbp?get=ESTAB,EMP&NAICS2017=72&EMPSZES=001&for=metropolitan%20statistical%20area/micropolitan%20statistical%20area:41180
Accommodation and food services: establishments6,3842023
api.census.gov/data/2023/cbp?get=ESTAB,EMP&NAICS2017=72&EMPSZES=001&for=metropolitan%20statistical%20area/micropolitan%20statistical%20area:41180
Manufacturing: paid employees110,0312023
api.census.gov/data/2023/cbp?get=ESTAB,EMP&NAICS2017=31-33&EMPSZES=001&for=metropolitan%20statistical%20area/micropolitan%20statistical%20area:41180
Manufacturing: establishments2,2202023
api.census.gov/data/2023/cbp?get=ESTAB,EMP&NAICS2017=31-33&EMPSZES=001&for=metropolitan%20statistical%20area/micropolitan%20statistical%20area:41180
% under 20 staff · computed: total establishments minus the six size classes of 20+ employees, divided by the total83.52023
api.census.gov/data/2023/cbp?get=ESTAB,EMP,EMPSZES&NAICS2017=00&for=metropolitan%20statistical%20area/micropolitan%20statistical%20area:41180
541511 per 10,000 · computed: NAICS 541511 establishments / total establishments x 10,00065.12023
api.census.gov/data/2023/cbp?get=ESTAB,EMP&NAICS2017=541511&EMPSZES=001&for=metropolitan%20statistical%20area/micropolitan%20statistical%20area:41180 · api.census.gov/data/2023/cbp?get=ESTAB,EMP,EMPSZES&NAICS2017=00&for=metropolitan%20statistical%20area/micropolitan%20statistical%20area:41180
5415 per 10,000 · computed: NAICS 5415 establishments / total establishments x 10,000146.72023
api.census.gov/data/2023/cbp?get=ESTAB,EMP&NAICS2017=5415&EMPSZES=001&for=metropolitan%20statistical%20area/micropolitan%20statistical%20area:41180 · api.census.gov/data/2023/cbp?get=ESTAB,EMP,EMPSZES&NAICS2017=00&for=metropolitan%20statistical%20area/micropolitan%20statistical%20area:41180
Change since 2018 · computed: total establishments 2023 minus 2018-3,1272023
api.census.gov/data/2023/cbp?get=ESTAB,EMP,EMPSZES&NAICS2017=00&for=metropolitan%20statistical%20area/micropolitan%20statistical%20area:41180 · api.census.gov/data/2018/cbp?get=ESTAB,EMP,EMPSZES&NAICS2017=00&for=metropolitan%20statistical%20area/micropolitan%20statistical%20area:41180

U.S. Census Bureau · census.gov/programs-surveys/cbp.html · census.gov/programs-surveys/acs

Where the search figures come from

Monthly US searches, cost per click and keyword difficulty from Semrush Keyword Overview (Bulk Analysis, US database, exact match), pulled 2026-10-24 13:05-13:15 ET. A phrase Semrush has no data for counts as zero. Every place we considered is ranked by the same sum: St. Louis is 15 of 134.

PhraseSearches a monthCost per clickDifficulty
web design st louis880$16.8937
website development st louis720$15.4026
web design company st louis210no bid data34
web developer st louis140no bid data8

Google and Bing autocomplete, read 24 October 2026, also completed: “web design st louis mo”, “website design st louis”, “web development st louis”. Autocomplete shows phrasings people type, not volumes.

Semrush · semrush.com/analytics/keywordoverview · Google and Bing autocomplete

Photo credit

The Gateway Arch and downtown St. Louis across the Mississippi River under a clear sky.

CreditJefferson National Expansion Memorial, NPS from St. Louis, MO, USA / Wikimedia Commons / CC BY 2.0 (cropped, resized)
LicenseCC BY 2.0 · creativecommons.org/licenses/by/2.0
Sourcecommons.wikimedia.org/wiki/File:Gateway_Arch_as_seen_from_East_St._Louis,_IL_(5263761913).jpg
Changescropped to 16:9, resized

Our Google Business Profile figures

What our Google listing showed when a person at OneAlgorithm read it. We quote the figures; the reviews are not marked up as ratings on this page.

ListingOneAlgorithm Consulting
Rating5.0 from 6 reviews
Place idChIJnQw01SfzxokRJhcvpzCljCE
Read on23 October 2026
Map linkmaps.app.goo.gl/kVEeTz9dCyB64CGk6

Hero photograph: Jefferson National Expansion Memorial, NPS from St. Louis, MO, USA / Wikimedia Commons / CC BY 2.0 (cropped, resized) · creativecommons.org/licenses/by/2.0